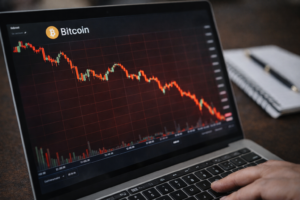
Ethereum price enters ‘oversold’ zone for the first time since November 2018

Ethereum’s native token Ether (ETH) entered its “oversold” territory this June 12, for the first time since November 2018, according to its weekly relative strength index (RSI).
This is the last time $ETH went oversold on the weekly (hasn’t confirmed here yet).
I had no followers, but macro bottom ticked it.
Note, you can push way lower on weekly rsi, not trying to catch a bottom. https://t.co/kLCynTKTcS
— The Wolf Of All Streets (@scottmelker) June 12, 2022
ETH eyes oversold bounce
Traditional analysts consider an asset to be excessively sold after its RSI reading fall below 30. Furthermore, they also see the drop as an opportunity to buy the dip, believing an oversold signal would lead to a trend reversal.
Ether’s previous oversold reading appeared in the week ending on Nov. 12, 2018, which preceded a roughly 400% price rally, as shown below.
While past performances are not indicators of future trends, the latest RSI’s move below 30 raises the possibility of Ether undergoing a similar—if not an equally sharp—upside retracement in the future.

Suppose ETH logs an oversold bounce. Then, the ETH/USD pair’s immediate challenge would be to reclaim its 200-week exponential moving average (200-week EMA; the blue wave) near $1,620 as its support.
If it does, bulls could eye an extended upside move toward the 50-week EMA (the red wave) above $2,700, up almost 100% from the price of June 12.
If not, Ether could resume its downtrend, with $1,120 serving as the next target, a level coinciding with the token’s 0.782 Fib line, as shown in the chart below.

Macro headwinds and a $650 Ether price target
The RSI-based bullish outlook appears against a flurry of bearish headwinds, ranging from persistently higher inflation to a classic technical indicator with a downward bias.
In detail, Ether’s price declined by more than 20% in the last six days, with most losses coming after June 10, when the United States Labor Department reported that the inflation reached 8.6% in May, the highest since December 1981.
Related: The total crypto market cap drops under $1.2T, but data show traders are less inclined to sell
The higher consumer price index (CPI) strengthened fears among investors that it would force the Federal Reserve to hike interest rates more aggressively while slashing its $9 trillion balance sheet. That dampened appetite for riskier assets, hurting stocks, Bitcoin (BTC) and ETH.

Independent analyst Vince Prince fears the latest ETH decline could extend until the price reaches $650. At the core of his downside target is a massive head and shoulders — a classic bearish reversal pattern with an 85% success rate in meeting its profit target, according to Samurai Trading Academy.
The massive head-and-shoulder formation forecasted earlier for #Ethereum has now been completely confirmed…
… $ETH is now headed towards the $650 USDT area!!! pic.twitter.com/R2KaqiorEd
— Vince Prince (@Vince_Prince_) June 12, 2022
Meanwhile, Glassnode’s lead on-chain analyst, known by the pseudonym Checkmate, highlighted a potential decentralized finance (DeFi) disaster that could crash Ether’s price further into 2022.
The analyst noted that the ratio between Ethereum’s and the top three stablecoins’ market capitalization grew to 80% on June 11.
Ratio is now at 80%
Market Cap of:#Ethereum = $181.58BTop 3 Stablecoins = $144.28BTVL in DeFi = $101.67B$ETH at $1215 makes for equal Ethereum and Top 3 stablecoin market caps.
The principle risk here is levered $ETH collateral in DeFi loans getting liquidated in a cascade https://t.co/26u0vXnMMY pic.twitter.com/q555clRaap
— _Checkɱate ⚡ (@_Checkmatey_) June 12, 2022
Since “most people borrow stablecoins” by providing ETH as collateral, the potential of the Ethereum network becoming less valuable than the top dollar-pegged tokens would make the debt’s value higher than the collateral itself.
Checkmate noted:
“There is nuance as not all stablecoins are borrowed, and also not all are ON ethereum. But nevertheless, the risk of liquidations [is] a hell of a lot higher than it was three months ago.”
The views and opinions expressed here are solely those of the author and do not necessarily reflect the views of Cointelegraph.com. Every investment and trading move involves risk, you should conduct your own research when making a decision.